Posts
Notebook: rerunning an analysis from two years ago
What it took to reproduce an old bootstrap analysis, and why its confidence interval moved in the third decimal place.
A reviewer asked for one more column in a table produced two years ago. Adding a column means rerunning the analysis, and rerunning it means first showing that the old numbers come back. This entry records what that took.
Checklist
#- Check out the tagged commit that produced the submitted table
- Recreate the environment from the lock file
- Verify the input data against the recorded checksums
- Rerun the pipeline end to end and compare every cell
- Record the seed of every random step
- Add the new column and log the rerun
The first four steps took an afternoon:
git switch --detach analysis-2023-v2
sha256sum --check data/SHA256SUMS
python -m venv .venv
.venv/bin/pip install --requirement requirements.lock
.venv/bin/python run.py --table 3 --output rerun/
The checksums matched, the environment installed, and every point estimate in the table came back identical to the last printed digit. The confidence intervals did not.
What differed
#| Item | Two years ago | Today | Effect on the table |
|---|---|---|---|
| Commit | analysis-2023-v2 | same | none |
| Input data | recorded checksums | match | none |
| Package versions | lock file | same lock file | none |
| Bootstrap seed | not recorded | chosen afresh | intervals moved in the third decimal |
The pipeline drew its bootstrap resamples from a generator seeded from the operating system. That is a reasonable default for a single run and a poor one for a result that must be reproduced: the original seed was never written down, so the original resamples cannot be recovered.
How much does the interval move?
#The question worth answering is whether the change matters. The bootstrap interval is itself a Monte Carlo estimate, so it has its own sampling error, which shrinks as the number of resamples grows. To measure it, I took a sample like the one in the table, 60 skewed observations with mean 1.061, and computed the same 95 % percentile interval for the mean with thirty different seeds.
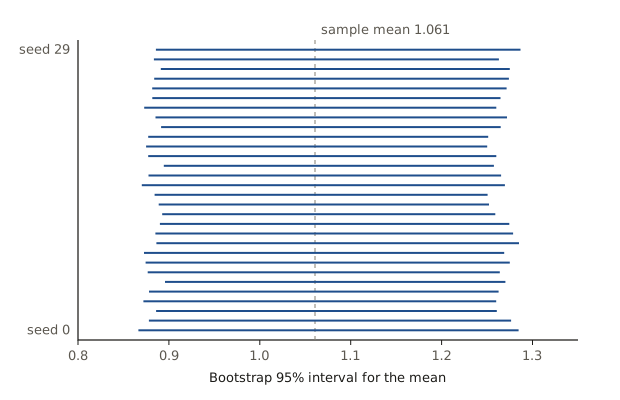
With , the upper endpoint ranged from 1.250 to 1.287 across seeds. Its standard deviation falls roughly as :
| Resamples | SD of lower endpoint | SD of upper endpoint |
|---|---|---|
| 200 | 0.014 | 0.023 |
| 1,000 | 0.008 | 0.010 |
| 5,000 | 0.003 | 0.005 |
| 20,000 | 0.002 | 0.002 |
The original analysis used 1,000 resamples, a common recommendation for percentile intervals.1 The differences between the published and the rerun intervals were all within one Monte Carlo standard deviation. The conclusions stand; the third decimal never meant anything.
Notes for next time
#- Seed
- The integer that initializes a random generator. Write it down with the name of the generator and the version of the library, and pass it explicitly to every function that draws random numbers.
- Monte Carlo error
- The variability of a result that comes from simulation rather than from the data. Report it, or choose enough resamples that it is smaller than the precision you print.
- Lock file
- A list of the exact version of every package an analysis used, including indirect dependencies. It reproduces the environment; it does not reproduce randomness.
The two open items on the checklist are now done: every random step takes a seed from the configuration file, and the configuration file is part of the commit.
Bradley Efron and Robert J. Tibshirani, An Introduction to the Bootstrap (Chapman & Hall, 1993), discuss how many replications confidence intervals need. ↩︎